Reports
Insights-driven testing starts here.
Benefits
Illumination
Everything in Testlio is traceable and transparent. Unlike some crowdtesting companies, freelance community activities and platform utilization are clearly reported. Important data is accessible and enlightening.
Assurance
With Testlio reports, you can rest assured that important tests, plans, and runs were executed—exactly at the right times, in the right locations, on the right devices.
Experimentation
All of your testing data reporting in a single location allows you to try different approaches, rhythms, spreads, and cadences.
Concentration
Testlio Reports equip you to focus your testing energy in areas that have the potential for high return. You can tune different approaches (e.g. exploratory vs functional testing) in a myriad of ways, ensuring that you have an optimal return on your QA and testing investments.
Customized
The Testlio Services team can create and deliver custom reports.
Functionality
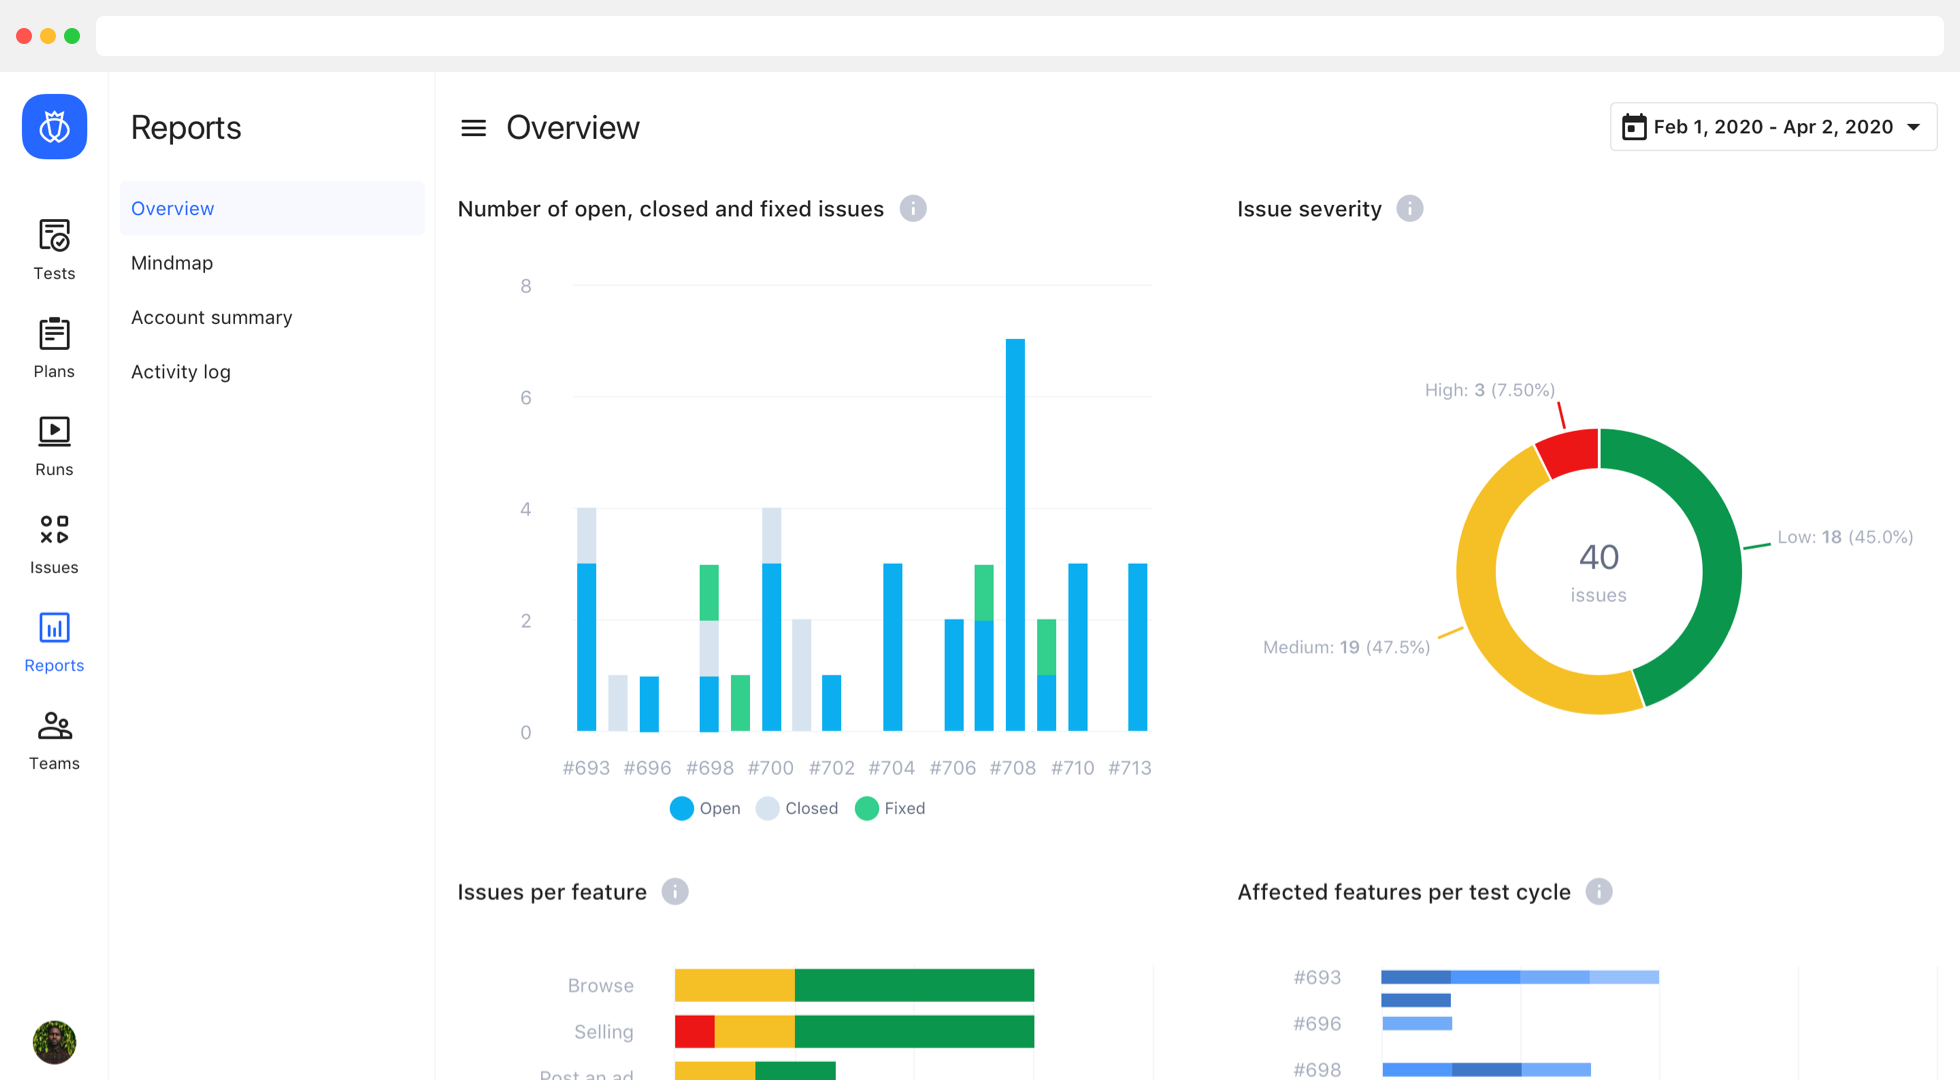
Issues
Understand trends, severity, and more.
Passes
Quickly glean pass/fail rates by multiple factors (including Runs).
Coverage
Understand and experiment with locations, languages, devices, OSes, etc.
Productivity
Learn who is reporting issues—and when testing is most efficient.
QBRs
Standard for your Testlio partnership is a quarterly business review.